
Custom sales dashboard for Epicor Eclipse
We built a dashboard that helps sales personnel see their sales performance and estimate the bonus they could receive, using sales data pulled from the Epicor Eclipse ERP API.
Discuss your Eclipse project- Platform
- Epicor Eclipse ERP
- Data connection
- Eclipse ERP API
- Deliverable
- Custom sales dashboard
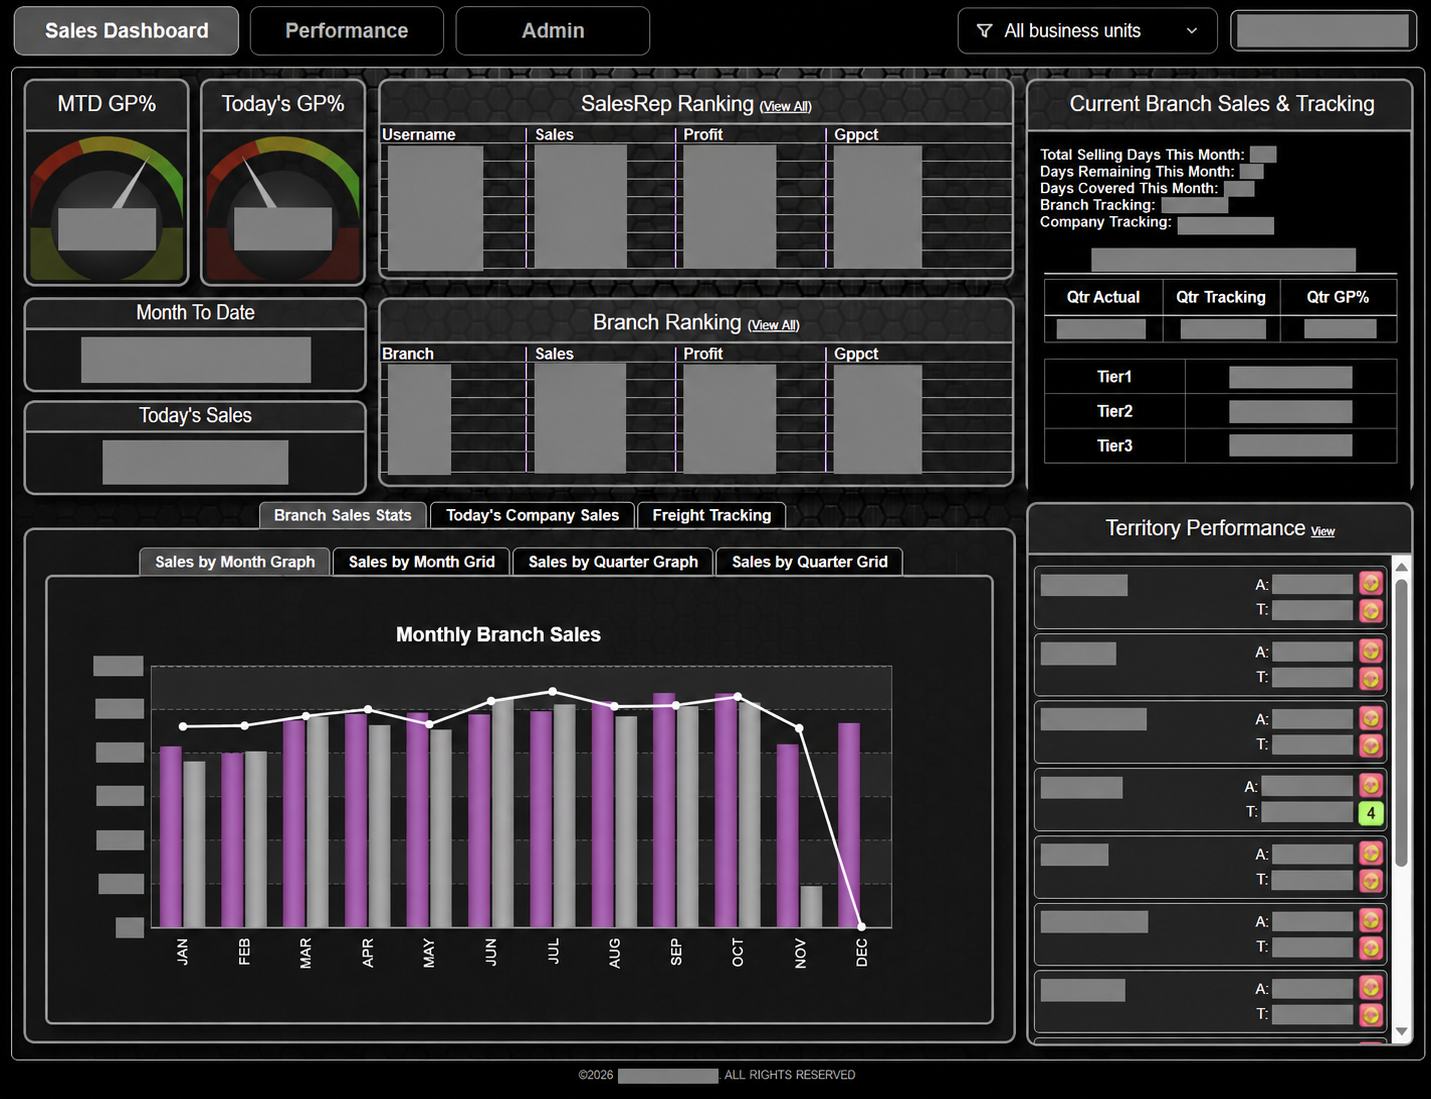
Sales performance and potential bonuses in one view
The dashboard gives sales personnel a dedicated view of their performance alongside an estimate of their potential bonus. Eclipse supplies the sales data through its API.
How the pieces connect
- Epicor Eclipse ERP
The source system for the sales data. - Eclipse ERP API
The connection between Eclipse and the custom application. - Sales dashboard
The interface where sales personnel review their performance and potential bonus.
How often the data updates
The application pulls data from the Eclipse API approximately every five minutes, with major data refreshes happening nightly. The dashboard reflects the data available through the API at each pull.
Learn about Eclipse on Epicor's websiteFrom sales performance to potential bonus
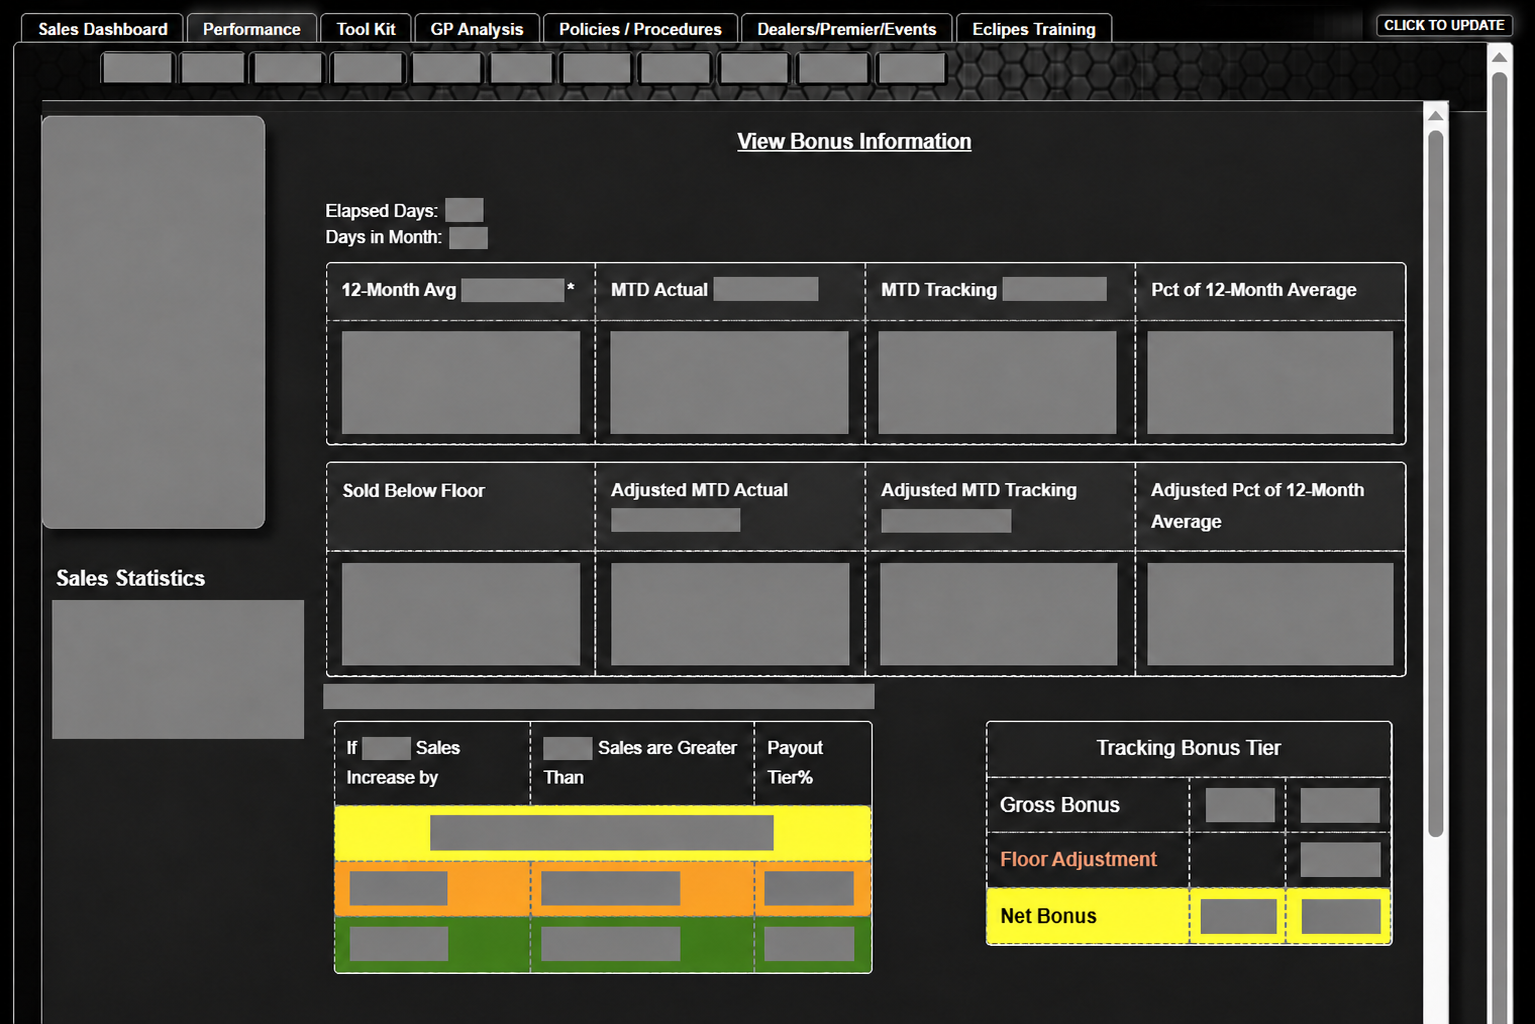
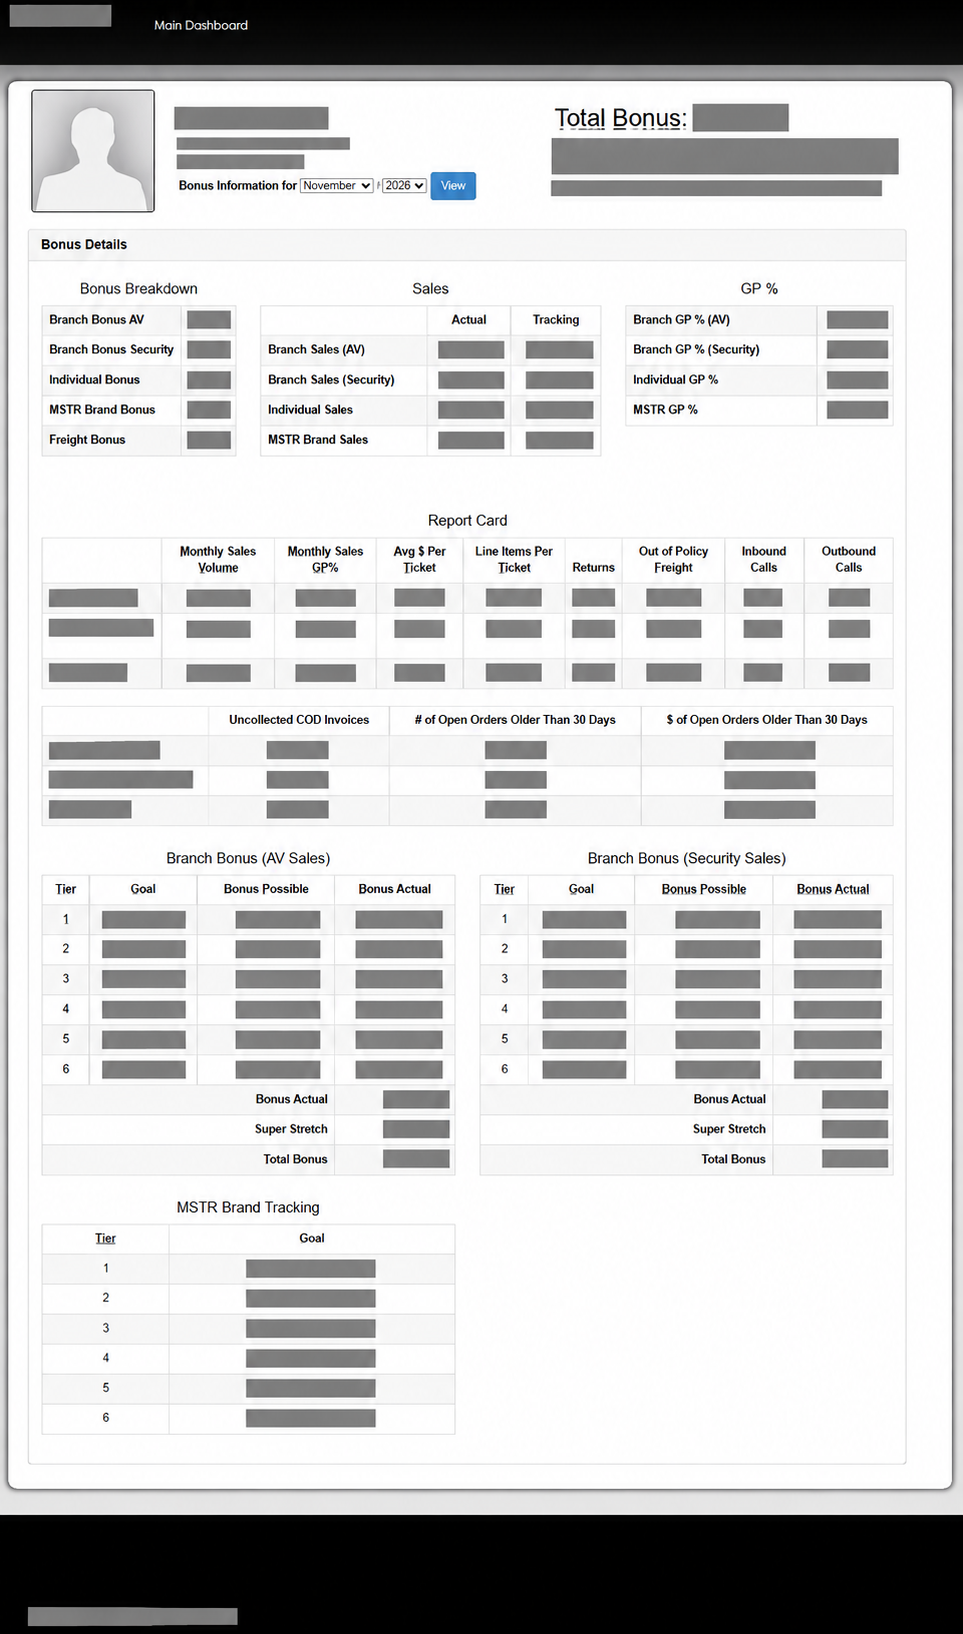
Sales personnel can review their performance, see how it relates to bonus tiers, and explore a detailed breakdown of their potential bonus. The displayed estimate may differ from the final payout.
Have an Eclipse reporting project in mind?
Tell us who needs the report, what they need to see, and how they work today. We'll discuss the data and connections needed for your dashboard.
Discuss your dashboard